If not yet enabled, enable and access the Roth Projection Tool. Once you have completed the steps in building out your Roth Projection framework here, you can move on to the last step, adding Roth conversions and interpreting those results.
Contents (jump to):
Welcome to the Roth Projection
The Control Panel
- Graph Toggles and Input /Present Value Options
- Warnings
- General Assumptions (inflation / itemized deductions)
- Report Headings
- Clients
Assets
- Taxable Assets (and Percent of Returns Attributable to Growth)
- Tax-Deferred Assets (and Tax Liability Adjustment/Assumption)
- Roth Assets
Client Assumptions
- Life Expectancy
- Income Sources (including any Custom Income)
Expenses
- Spending (including any Custom Expenses)
- Excess Cashflow Options
- Medicare Assumptions
Roth Conversions
Qualified Charitable Distributions (QCDs)
Other Control Panel Features
- Advisor Notes
- Export Results
Need Help? Contact Us
Welcome to the Roth Projection
Upon first entering a new Roth Projection, users will be prompted to take a video demo tour of the Roth Projection Tool. Click the "Start Tour" button circled below. To revisit the tour at any time, click the "Take a Tour" button on the Roth Projection screen. Additionally, users can access the Roth Projection Tool section in the Knowledge Base by clicking the underlined link in the Welcome screen. 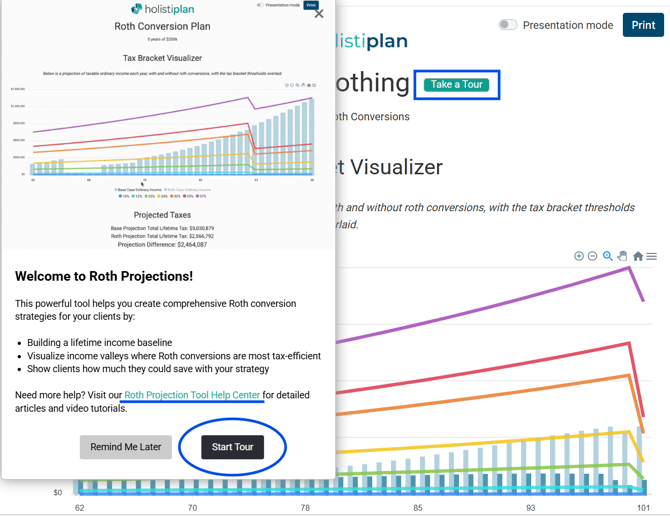
Check out the video below, where we walk through the steps to build the framework of a Roth Projection analysis.
HOLISTINOTE: The video below may not include the newest features, design changes, and improvements that have been made since the video was recorded. We will update the video below as new features and changes are released!
To replicate the case study in the video above and the entries in the screenshots below, use the following "The Joy of Rothing" cheat sheet linked below:
The Joy of Rothing - Case Study Assumptions
The Control Panel
Users can edit assumptions and make other changes to the Projection data within the Control Panel on the left-hand side of the page.
The right side of the screen will show a preview of the Roth Projection output. In the upper right-hand corner of the page, users can view the Roth Projection in Presentation Mode (without the Control Panel) by sliding the Presentation Mode toggle or print the Roth Projection by clicking the Print button.
- Graph Toggles and Input /Present Value Options - This section includes multiple toggles that show or hide the Tax Bracket Visualizer, Projected Taxes, IRMAA Surcharges, Portfolio Value, Portfolio Value Difference, Portfolio Value by Asset Type, RMDs, Roth Conversions, and Distributions by Account Type sections, as well as an option to only show the last 5 years of portfolio balance estimates.
Additionally, users can choose to input data by the calendar year or client age, and to show tax and IRMAA differences in nominal dollars (unadjusted) or today's dollars (net present value using a discount rate).
For more resources on the appropriate discount rate to use when evaluating Roth conversions, click on the informational message icon circled below. Advisors are likely familiar with using the inflation assumption as a discount rate in time-value-of- money (TVM) calculations, but the linked resources go into greater depth as to how to think about more appropriate discount rates. Note that Holistiplan is agnostic on this issue; any defaulted value that appears is not a reflection of Holistiplan's opinions or best practices.
- Warnings - These cautionary warnings indicate when some entries end up not being modeled fully as intended, due to calculations made within the analysis. Any warnings preventing the Roth Projection analysis from being completed will appear in red at the top of the Roth Projection page.

- General Assumptions -
- Inflation: Enter the assumed inflation assumption for tax brackets, standard deduction, and IRMAA brackets. Inflation assumptions for spending and income items are added for each of those items individually, and not in this field.
- Itemized Deduction (Optional): The standard deduction amount is used by default, but an itemized deduction assumption can be used instead. As seen below, Holistiplan will compare the standard deduction and any itemized deductions for any given tax year and use the one that results in the least amount of tax.

Select a start age or year, and then add rows as needed to start that itemized deduction amount, and an end age or year (if desired) to end that election.
- Report Headings - Adjust the name of a Roth Projection by changing the title and subtitle here.

- Clients - Adjust the information for the clients associated with the Roth Projection, including filing status, assigning Taxpayer/Client 1 and Taxpayer/Client 2, the year the analysis will begin, and whether either taxpayer is eligible for the additional standard deduction for blindness. Holistiplan will use the client names entered for Client 1 and Client 2 to refer to those clients throughout the results shown in the Roth Projection Tool.

Assets:
The Roth Projection Tool makes use of three types of assets: Taxable Assets, Tax-Deferred Assets, and Roth Assets. Users can assign a unique rate of return assumption to each asset type. Note that the projection starts with a default return for each asset type - this is not an indication of Holistiplan's beliefs for future returns and is instead an arbitrary amount. Users should update their return assumptions to be consistent with their clients' portfolios and their firm's investment philosophies.
- Taxable Assets:

First, enter the combined balance of all non-retirement accounts, including both cash and investments, in the Assets field outlined in blue above. Second, enter the cost basis on that basket of assets in the Cost Basis field outlined in yellow above. This cost basis will be used to determine the net capital gains and the tax impact of any distributions from that taxable assets balance. Third, enter the assumed Rate of Return of all these taxable assets in the field outlined in green.
Finally, indicate the Percent of Returns Attributable to Growth, where outlined in red above. This assumption allows you to indicate how much of the rate of return is due to growth and how much is due to income. The default value for this field is 50%, but that value is purely arbitrary.
A higher portion of returns that are attributed to growth results in less tax drag, making the taxable account more tax-efficient. A good proxy for this assumption is for the percentage to equal the equity allocation of the taxable assets. For example, if the taxable assets are invested 50% stocks and 50% bonds, then attributing 50% of the portfolio return to growth may be a good approximation. But keep in mind that the taxable assets balance may include cash as well as stocks and bonds.
HOLISTITIP: The example above assumes that John and Jane have $250,000 of taxable assets and a cost basis of $100,000 that will return 6%, with half of that return attributable to growth and half to income. This means that half of the 6% return will be taxed each year as income, while the other half grows without any tax drag.
- Tax Deferred Assets:

First, enter the total balance of any tax-deferred assets that are subject to RMDs (Required Minimum Distributions) for each client in the Assets fields for each, where outlined in blue above. Next, enter an annual return assumption for those tax-deferred assets.
CAUTION: Do not include Inherited IRAs subject to RMDs here. Instead, enter those as a stream of income (as discussed in Income section below).
Finally, to account for the embedded tax liability of those tax-deferred assets, check the box in the Tax Liability Assumption / Adjustment for Tax-Deferred Accounts section outlined in yellow above, and enter a percentage assumption for that tax liability. Some argue this adjustment makes for a more "apples-to-apples comparison" between tax-deferred assets and Roth balances by accounting for the embedded tax liability in Traditional IRAs, 401(k)s, etc.
If this box is checked, Holistiplan defaults to an arbitrary 22% tax liability assumption. Users should consider what might be appropriate for their clients. In a perfect world, this value would be equal to the time-weighted average effective tax rate the clients are subject to for the remainder of the plan. However, since that is a difficult assumption to peg, many advisors will use a percentage equal to the marginal tax bracket expected for the analysis, as seen in the taxable ordinary income numbers for the Base Case in the Tax Bracket Visualizer graph.
HOLISTITIP: The example above assumes John and Jane each have $500,000 of tax-deferred assets, with an assumed annual rate of return of 6%, and that the projection should adjust any tax-deferred balances by an assumed tax liability of 22%.
As a result, the combined $1,000,000 starting balance of tax-deferred assets for John and Jane is reduced by 22% ($220,000). The Portfolio and Portfolio Comparison graphs, therefore, model those tax-deferred assets using an effective after-tax balance of $780,000 in the first year of the projection
- Roth Assets:

Enter the combined balance for any Roth accounts for Client 1 and Client 2 in the field outlined in blue above. Then, enter an annual return assumption for those combined Roth assets.
Client Assumptions:
- Life Expectancy - Enter the life expectancy of each client. Holistiplan arbitrarily defaults to 100, but this is not a reflection of any embedded longevity assumptions.
- Income Sources - The Roth Projection uses income as the first source to meet any spending needs before moving to portfolio withdrawals, so be sure to include any income from the sources listed below:
- Wages
- Social Security
- Pensions
- Annuities
- Custom Income

The example below illustrates $150,000 of Wage Income for Client 1 to reflect John's wage income for two years, beginning at age 62, increasing by 2.0% per year, and ending at age 64, when he retires.
CAUTION: To illustrate a cash flow ending, enter a "$0" amount in the year following the last year of that series of income. Not entering a "$0" amount will cause that cash flow stream to continue indefinitely.
- The graph below the entry rows shows the shape of that income over time. Hover over any year of the graph to verify that income is the intended amount for that year.

Enter any income items in today's dollars (present value), and use the inflation field to indicate how that income stream will grow in future years. For example, the Social Security entry below uses an amount of $30,000 in today's dollars to begin at this client's age 70. Since this client is currently 62 years old , inflating $30,000 at a rate of 2% for year for 8 years results in an income of $35,150 at his age 70. In this case, there is no row with a $0 amount, so this cash flow continues until the client reaches the entered life expectancy age of 100.
- Custom Income:
Use this section to model income cash flows that don't fit into the predefined income source categories.
To add a custom income item, first click the "Add Custom Income" box at the bottom of the income section:
When custom income is added, an Income Source window will pop up that contains the following data entry fields. While the income name and tax type fields are required, the survivorship and percentage taxable fields can be left blank, and Holistiplan will assume there is no survivorship and that 100% of the income will follow the tax type selected.- Custom Income Name: (outlined in blue below)
- Survivorship %: Percentage of income (if any) that continues to a second member of the projection at the death of the client to whom the custom income item belongs (yellow box below)
- Tax Type: Tax nature of the custom income item (Ordinary Income, Long-Term Capital Gains, Tax-Free, or Self-Employment; green box below)
- Percentage Taxable: Percentage of income that may be subject to taxation if there is a split between taxable and tax-free income (outlined in purple). For example, the sale of a primary residence may bring cash flow into the client's projection. But depending on the details, some portion of that sale may be taxable and subject to long-term capital gains, while a larger portion may be received tax-free.

HOLISTINOTE: As with other income items, be sure to indicate the year that the income is received or the age the client will be when he/she receives it, the amount, and any inflation assumptions applicable to this income stream. Remember to include the year when the income stops by entering that year and "0" for the amount. Otherwise, the system will think that the income will persist for the duration of the projection.
HOLISTITIP: You only need to enter the net taxable gain, after any exclusions and cost basis is accounted for.
The example above assumes that John sells his and Jane's beach house for $2 million, but has a cost basis of $1 million for the beach house, and that long-term gain will be $1 million (today's dollars) when he turns 80. That $1 million gain is inflated at 2% per year from now, when John is 62, until John's age 80, resulting in $2,856,492 coming into his portfolio in that year as a long-term capital gain. Because this is a one-time event, to ensure that the income does not persist every year through the end of John's projection, enter a $0 row at John's age 81.
Expenses:
- Spending - For a more accurate and realistic projection, include the anticipated amount of annual lifestyle expenses. Holistiplan will tack on as additional expenses:
- Taxes: calculated within the analysis, and
- Medicare Premiums and any IRMAA: If applicable and entered in the Medicare Assumptions.
HOLISTINOTE: The Spending Assumption is entered annually and will be satisfied by income, and if necessary, portfolio distributions, in the following order:
- Income (Wages, Social Security, Pension, Annuity, or custom income)
- Portfolio Distributions:
- First: Taxable assets, then
- Second: Older spouse's tax-deferred assets, then
- Third: Younger spouse's tax-deferred assets, and finally
- Fourth: Roth (tax-free) assets, as needed.
- Custom Expenses:
Use "custom expenses" to model additional expenses beyond baseline spending, spending that might inflate at different rates of inflation, or one-time expense items.
To start, click the "Add Custom Expense" link in the Expenses section
In the subsequent Custom Expense window, you can enter:- The name of the custom item (blue box below)
- The year/age the expense begins, the annual amount (in today's dollars), and a custom inflation assumption for that particular expense (yellow box below).

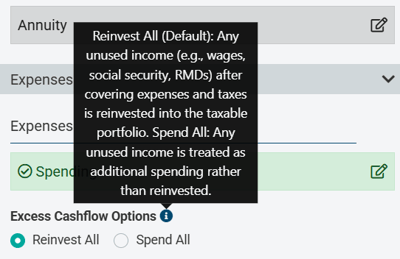
- Excess Cashflow Options - To the extent that income (Wages, Social Security, Pension, or Annuity) is enough to cover expenses (spending, taxes, Medicare premiums), any excess cashflow can either be toggled to "Reinvest All," which add that surplus each year back into taxable assets to be re-invested, or "Spend All," which considers any surplus to be additional expenses, lost to spending for the remainder of the analysis.
- Medicare Assumptions - Check the boxes for Medicare Part B and/or Part D to include a calculation of any IRMAA (Income-Related Monthly Adjustment Amounts) to Medicare premiums within the analysis. For Medicare Part B, indicate the age at which the client will begin receiving Medicare Part B benefits. For Medicare Part D, indicate the base annual Medicare Part D premium.

HOLISTITIP: While every participant in Medicare Part B starts with a base premium, for Medicare Part D, the premium varies based on the plan the participant selects and their location, which is why users need to enter a base annual Part D premium.
Roth Conversions:
HOLISTINOTE: Many advisors will wait until the full Roth Projection framework is complete to enter Roth conversion amounts based on the other data entered to better visualize possible Roth conversion opportunities.
The example shown here demonstrates entering the conversion amounts later in the process, as outlined in the Adding Roth Conversions and Interpreting the Results article.
Qualified Charitable Distributions (QCDs):
- Qualified Charitable Distributions (QCDs) - Enter any amount of QCDs a client may execute as a charitable giving strategy.

The example below describes $20,000 of QCDs for Client 1 beginning at their age 71 and continuing indefinitely, inflating at a rate of 6% (the same as the return rate). This allows the QCD amount to increase at the same rate the account is projected to grow over time.

HOLISTITIP: Don't forget to enter a $0 row if those QCDs end at a certain year/age. Otherwise, they will continue indefinitely. In the example above, the system assumes that QCDs will continue in an inflation-adjusted amount until the client dies.
Other Control Panel Features
- Advisor Notes - Use this section as a spot to record any notes about the analysis. The "Advisor Notes" section is not shown in the report, so these notes will not print when creating a PDF deliverable when viewing the Roth Projection analysis in Presentation Mode.
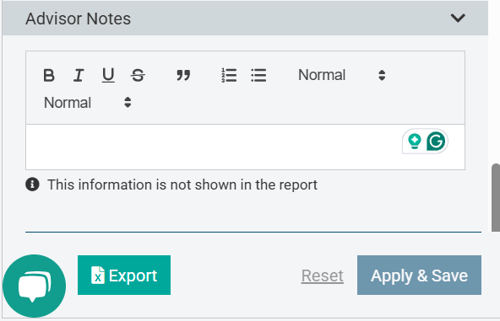
- Export Results - At the bottom of the Control Panel, click the "Export" button shown to view a spreadsheet of the math behind the projections.
That spreadsheet contains two tabs: one labeled "Projection" (representing the Base Case) and a second labeled "Roth Projection" (reflecting the Roth conversion scenario). The spreadsheet includes the variables and data that feed various graphs on the Report, including income sources and amounts, RMD amounts, changing portfolio balances over time, tax costs, etc. The column titles in the spreadsheet include comments that further define what is displayed in that column and, depending on the column in question, how that amount is calculated.The video below walks through the math under the hood of the spreadsheet.
Once you've built out your Roth Projection framework, you're ready to add Roth conversions. The article below describes the next steps in the Roth Projection workflow: Adding Roth Conversions and Interpreting the Results.
If you have any questions along the way, Contact our Support Team for more assistance!