If not yet enabled, enable and access the Roth Projection Tool.
If not yet built, build the Roth Projection Framework.
Jump to:
Tax Bracket Visualizer
- Adding Roth Conversions
- Fine-Tuning the Conversion Amounts
Projected Taxes
IRMAA Surcharges
Portfolio Value
Portfolio Value Difference
Portfolio Value by Asset Type
Required Minimum Distributions (RMDs)
Assumptions
Exporting Results
To replicate the case study in the videos and the entries in the screenshots below, please use the following "The Joy of Rothing" cheat sheet linked below:
The Joy of Rothing - Case Study Assumptions
Tax Bracket Visualizer
The first graph of the Roth Projection illustrates the amount of taxable ordinary income (e.g., wages, taxable Social Security, taxable interest, IRA distributions - including Roth conversions, etc.) for each year of the projection, as well as the various marginal tax brackets applicable to that taxable ordinary income.
NOTE: The Tax Bracket Visualizer intentionally shows only taxable ordinary income, as that is the income that is subject to the marginal tax brackets. This graph does not illustrate Total Income, Adjusted Gross Income, or Taxable Income.
This graph shows the peaks and valleys of taxable ordinary income across a client's lifetime, to better spot opportunities where low-income years may make Roth conversions more attractive. 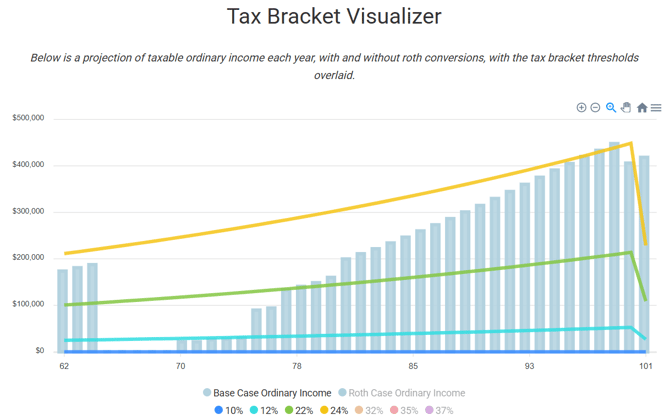
Users can show/hide any bracket by clicking on any of the bracket percentage labels (10%, 12%, 22%, etc.) for either the 'Base Case' or 'Roth Conversion' income labels to better focus on specific elements of the analysis. For example, the screenshot above "hides" the 32%, 35%, and 37% brackets because they are out of the scope for this client's income.
This particular example highlights a prime potential opportunity for Roth conversions in the years between when someone stops working but doesn't yet have to take Required Minimum Distributions (RMDs) from their Individual Retirement Accounts (IRAs).
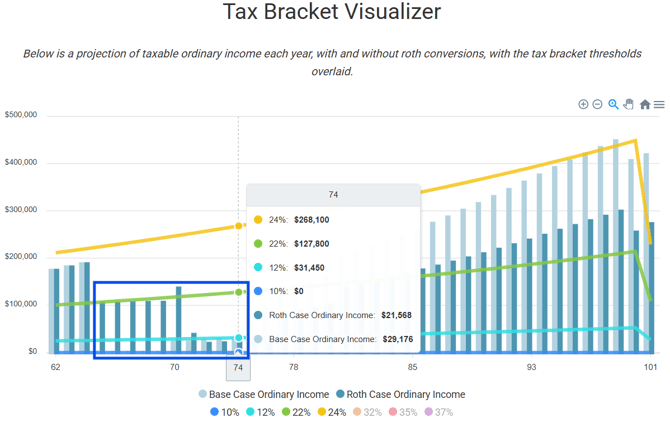
Users can further zoom in on particular ages or years to see the amount of ordinary income in the 'Base Case' and 'Roth Conversion' scenarios, along with the ordinary income levels where corresponding tax brackets begin, by hovering over any point on the graph. 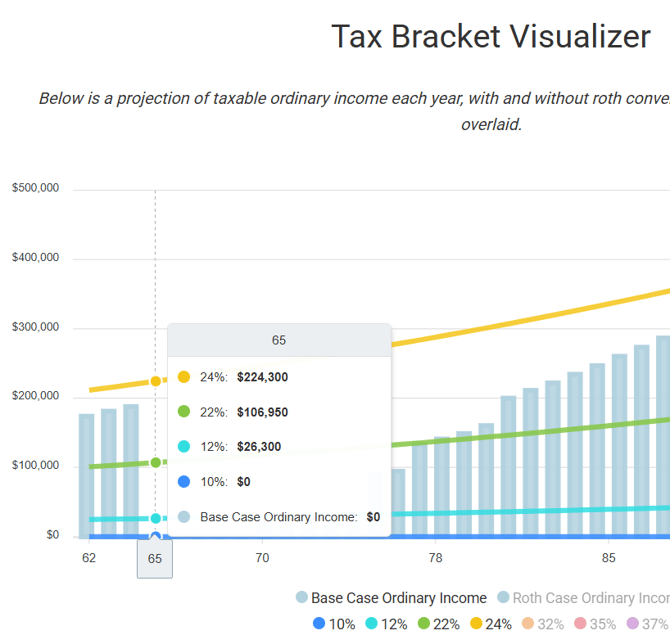
This example starts with $0 of taxable ordinary income. The table suggests that there is plenty of room until the 12% bracket stops, and the 22% bracket starts at $106,950 of taxable ordinary income. Hypothetically, if the goal is to max out the 12% bracket via Roth conversion, a user may wish to illustrate converting approximately $100K (adjusted for inflation) starting at age 64 until RMDs begin at age 75.
REMEMBER: the SECURE Act 2.0 change when RMDs start for people based on the year they were born. See the chart below.

Adding Roth Conversions
Adjust the amount and sequencing of the planned Roth conversions for client(s) by navigating to the Roth Conversions section of the Control Panel.
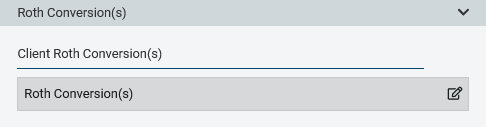
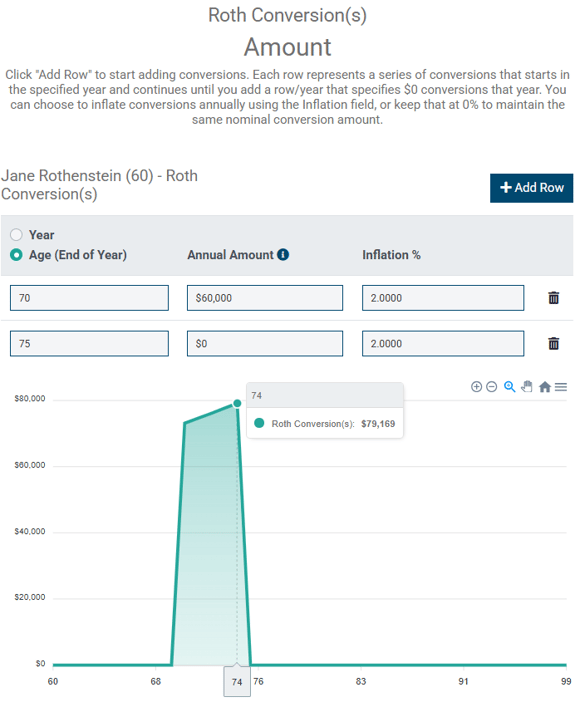
Click the pencil/paper icon to open the Roth Conversion screen. Similar to other screens in this tool, click +Add Row to add the row for the first year of conversions, along with the amount and any corresponding inflation adjustment for future years. Be sure to indicate the year when conversions are set to end; otherwise, the system will assume that conversions continue indefinitely.
The example below assumes that conversions begin at age 65 and continue until John's RMDs start at age 75. Notice that the age-65 amount isn't $100,000, but $100,000, inflated at 2% from John's current age of 62 until age 65, the year after John retires. Those conversions continue through John's age 74, the year before his RMDs start.
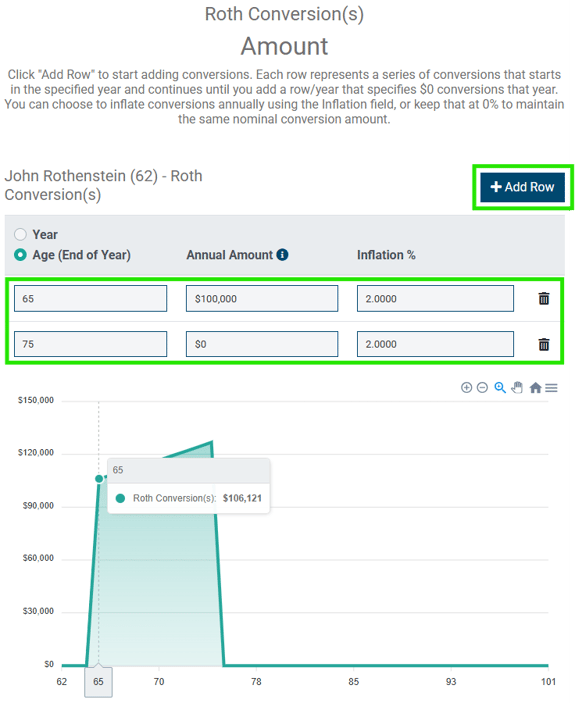
NOTE: Remember to enter a "$0" amount in the year following the last year of any series of income. Not doing so will cause that cash flow stream to continue indefinitely.
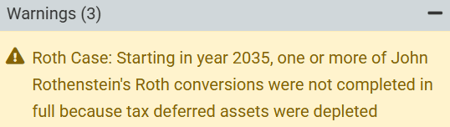
John's Roth conversions start to fill up the 12% bracket, as seen below. Note, however, that it looks like John's conversions end at age 71, despite data entry that attempted to model conversions going through age 74, the year before RMDs began at his age 75. Why is that?
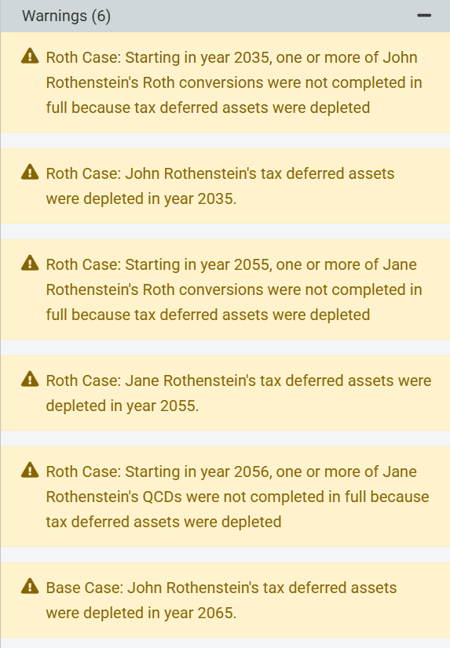
The "Warnings" section in the control panel gives us a clue. Even though the projection included conversions continuing until age 74, by age 72 (in 2035), John has fully converted all of his tax-deferred assets, so no more conversions are modeled.
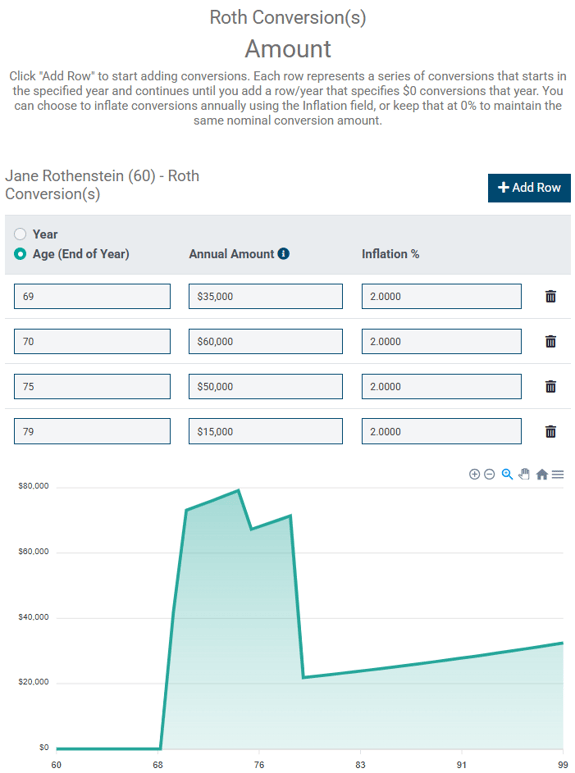
That leaves room to model some conversions for Jane, between John's age 72 (Jane's age 70) and when RMDs begin for Jane at her age 75 (when John is 77):
The resulting graph below shows, where outlined, Jane's conversions. The graph indicates that John and Jane have largely achieved the goal to max out the 12% bracket. But when John turns 70, he starts to receive Social Security income, which pushes taxable ordinary income over the 12% bracket and into the 22% bracket. Then, when John turns 75, his RMDs push income even higher into the 22% bracket. While not perfect, this is a good foundation and gives us something to work from. 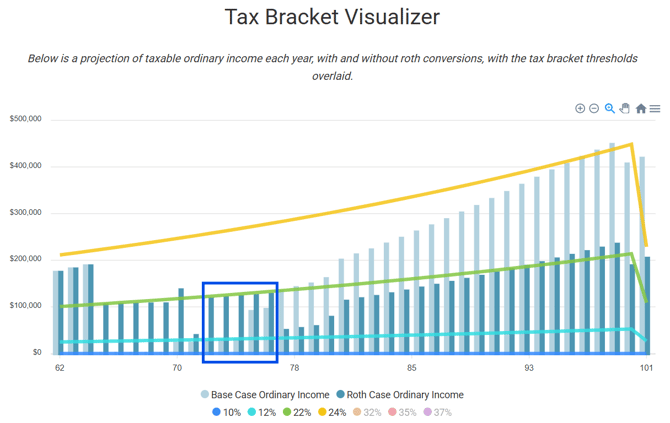
Fine-Tuning the Conversion Amounts
There will be some element of plug and play to fine-tune a Roth conversion strategy, as shown above. After some editing of the amounts, this Roth conversion strategy for John and Jane has been optimized to max out the 12% bracket over time.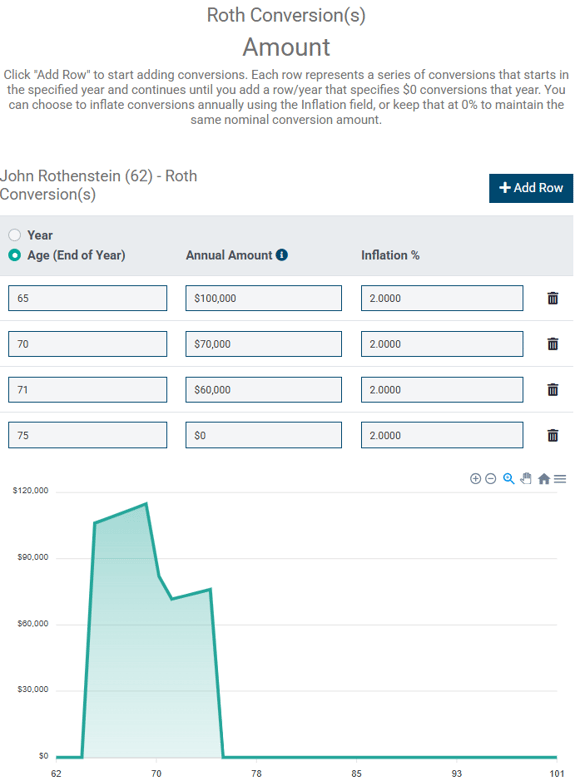
After those fine-tuned adjustments, John and Jane's conversion plan is illustrated in the Tax Bracket Visualizer below. Notice now that John has converted all of his tax-deferred assets, as has Jane, as indicated by the "Warning" in the control that indicates not all entered Roth conversions for Jane were completed due to those tax-deferred assets being depleted by 2055. Also, because Jane depleted her tax-deferred assets, her planned QCD in 2056 did not happen.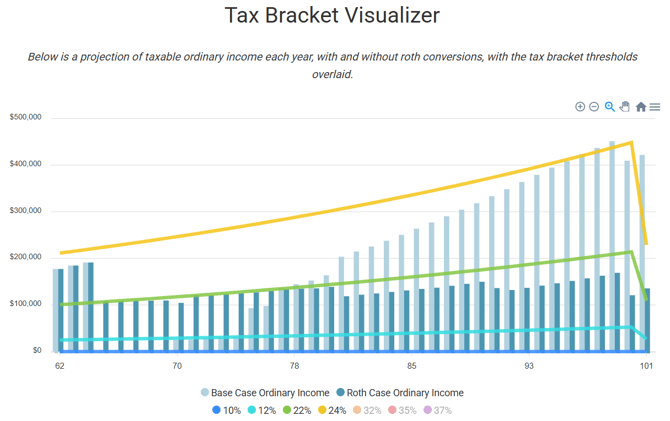
Projected Taxes
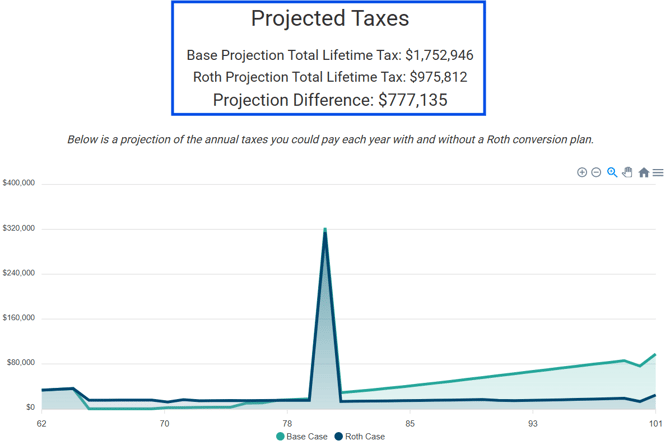
The Projected Taxes graph shows lifetime tax projections of both the base scenario (green) and the Roth conversion scenario (blue). The projection difference indicates the lifetime tax savings anticipated by executing the Roth conversions. In the example above, the multi-year Roth conversion plan is projected to result in $777,135 less in taxes compared to the base scenario with no conversions. Note the spike in taxes at John's age 80 as a result of the capital gains from selling the beach house in that year.
To acknowledge the impact of the Time Value of Money, users can display the net present value of the nominal amount of tax savings by clicking the appropriate radio button in the Control Panel, as shown below, along with a desired discount rate. The example below uses a discount rate of 6%, identical to the portfolio return assumption. The tool tip/(?) icon associated with the Discount Rate field contains links to resources that discuss which discount rates are appropriate for this kind of analysis. 
Even when discounting the tax savings, there is a respectable amount of tax savings as a result of undertaking this Roth conversion strategy, as seen below.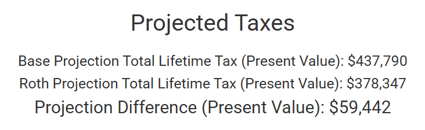
Medicare - Income Related Monthly Adjustment Amount (IRMAA Surcharges)
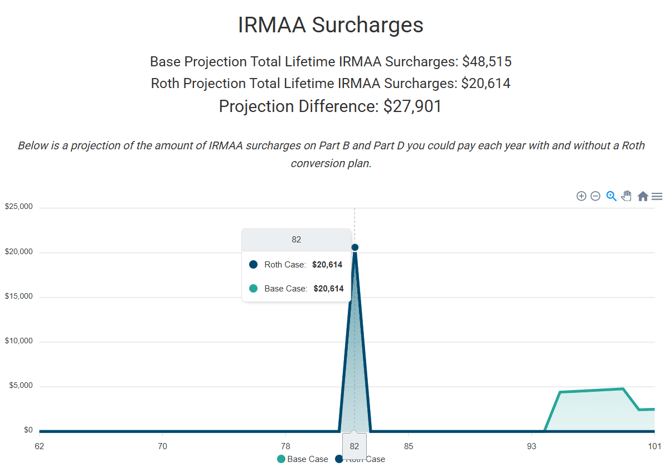
While not technically a tax, Income-Related Monthly Adjustment Amount (IRMAA) surcharges on Medicare Part B and D Premiums can be a consideration for Roth conversion planning. To enable this additional graph and include IRMAA surcharges in a Projection, toggle on this option in the Control Panel.
The example above indicates a savings of $27,901 in IRMAA surcharges, resulting from reduced income in later years due primarily to lower RMDs in the Roth case compared to the base case. The increased IRMAA surcharge at John's age 82 is a result of the large capital gains at his age 80 as a result of selling the beach house. Similar to the Projected Taxes graph, users can display either the nominal amount of IRMAA differences or the discounted present value. 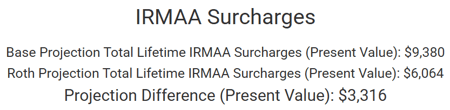
Portfolio Value
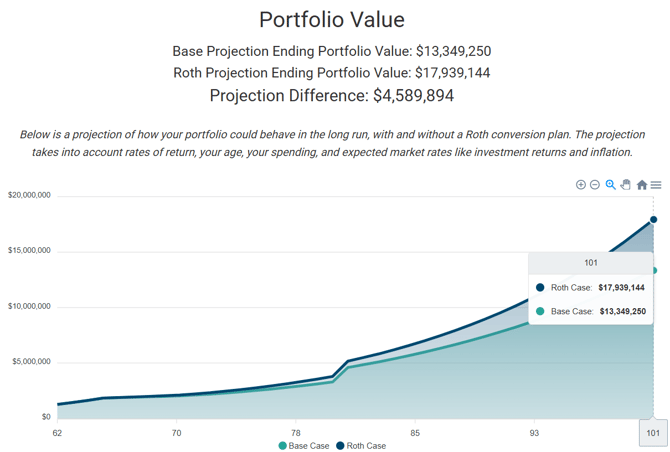
This graph will show the cumulative effect of the Roth conversions on the combined portfolio balance by the end of the plan, which corresponds to the user-entered life expectancy for the longest-lived member of the household.
In the example above, the projected total portfolio balance is $17,939,144 for the Roth Case, compared to $13,349,250 for the base case, resulting in a portfolio value difference of $4,589,894 for the Roth Case.
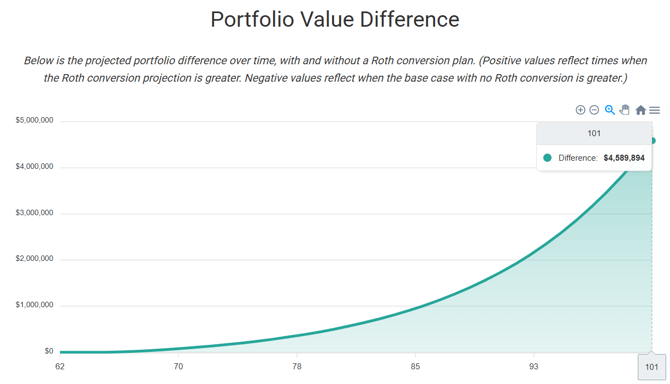
The base case and Roth conversion lines on the graph are sometimes so close that it may be difficult to see the difference. The "Portfolio Value Difference" helps to better indicate that difference in such cases by plotting the total portfolio value of the Roth Case minus the Base Case in each year of the projection. The point at which the curve becomes positive is sometimes referred to as the 'break-even' or 'crossover point,' whenthe Roth Case portfolio value ultimately overcomes the hurdle of the cost of the conversion and any associated opportunity cost of foregone returns on the amount of taxes paid.
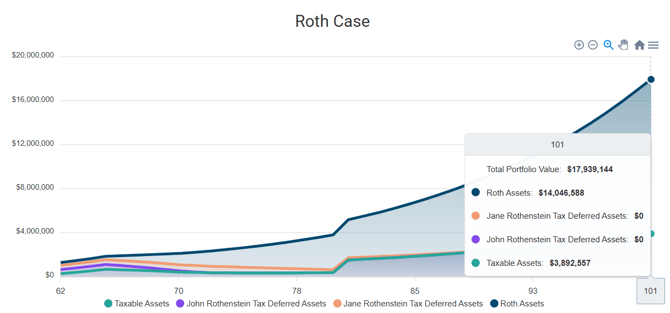
Portfolio Value by Asset Type
This chart breaks out the total portfolio balance across the three asset types (taxable, tax-deferred, and Roth) for both the Base Case and Roth Case. To see the balances for any given year, hover over the graph area for that year. These two graphs are particularly powerful in illustrating the mix of assets a client will pass on to their beneficiaries if there is a legacy goal in connection with a Roth conversion strategy.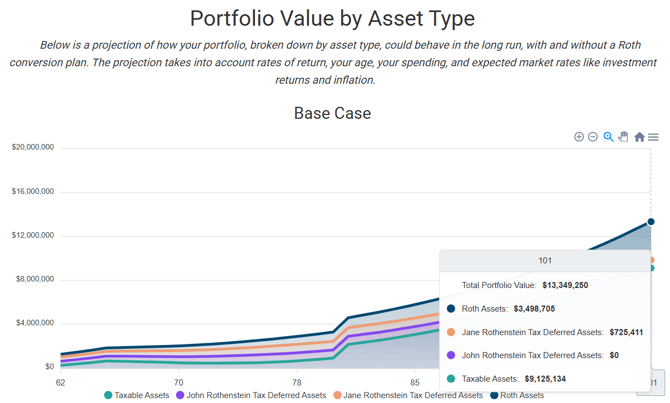
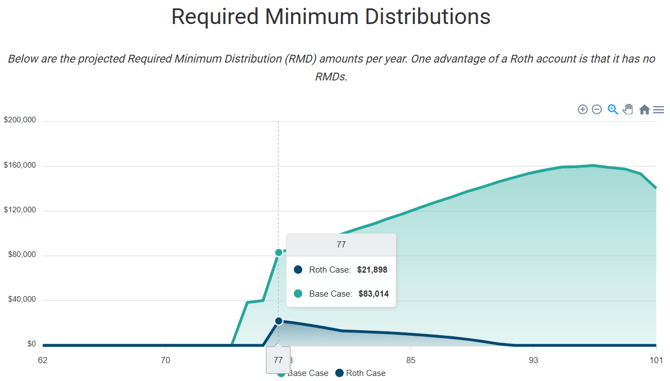
Required Minimum Distributions (RMDs)
If toggled on in the Control Panel, the Required Minimum Distributions graph will show the projected Required Minimum Distribution (RMD) amounts coming from tax-deferred accounts for both the Base Case and Roth Conversion scenarios. This can be particularly helpful in illustrating the impact of Roth conversions on potentially reducing RMDs in later years, especially for clients who will not need their full RMD to meet spending needs. In the example below, this series of Roth conversions will lower the RMDs these clients would otherwise have to take.
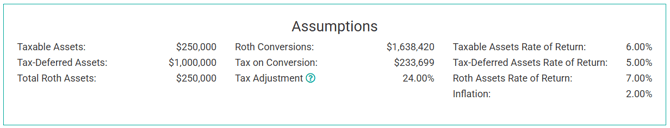
Assumptions
The bottom of the Roth Projection will include a summary of the assumptions used in the analysis.
Exporting Results
At the bottom of the Control Panel, click the "Export" button shown below to view a spreadsheet of the math behind the projections. 
That spreadsheet contains two tabs - one labeled "Projection" (representing the Base Case) and a second labeled "Roth Projection" (reflecting the Roth conversion scenario). The spreadsheet includes the variables and data that feed various graphs on the Report, including income sources and amounts, RMD amounts, changing portfolio balances over time, tax costs, etc. The column titles in the spreadsheet include comments that further explain that particular variable and, depending on the column in question, any associated calculation for that data point.
For more details, this video walks through the math under the hood in the spreadsheet.