Reporting - Tax Screen
Holistiplan's Tax Reporting feature creates customized, filtered reports with multiple data points.
While we've expanded over time what users can see on the All Households screen, there's a limit to what we can show and still have that screen be usable. At the same time, we recognize that users may want to extract more pieces of information from multiple clients' returns for data gathering and reporting functions.
Holistiplan's Reporting - Tax feature allows for exactly that. Users should see an entry in the Tools & Resources dropdown; add a new report by clicking Add New Report
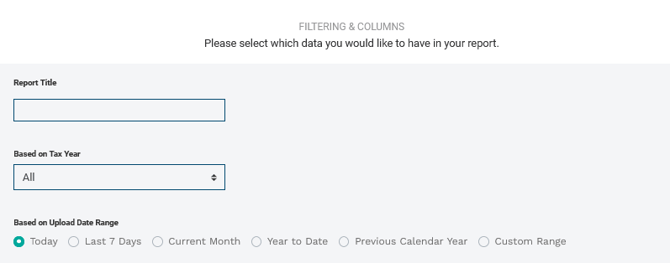
The subsequent filtering & columns screen allows users to identify the tax years, upload date range, and various data points they wish to search and add to their report:

- Report Title is the name of the Report and should be used to distinguish it from other reports.
- Based on Tax Year allows users to indicate which tax years they wish to search. Users can select individual years (e.g., Most Recent Tax Year, 2022, 2021, etc.) or All years.
- Based on Upload Date Range limits the search to returns uploaded within the specified range.
If the report returns no data, the first thing to check is the upload date range, as the default radio button is marked as "Today." Unless a user changes the upload date range, the initial search will look for returns uploaded on the day that the initial query is run.
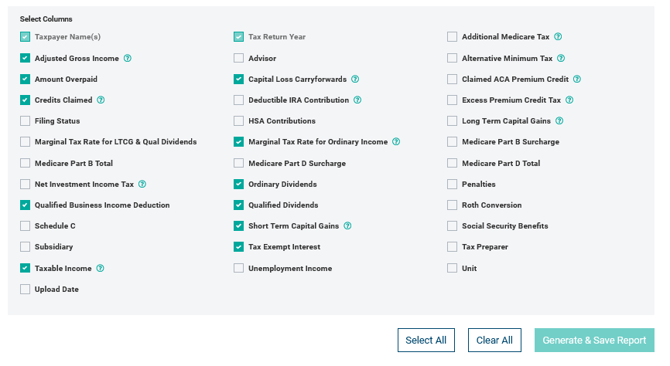
Users can then select which columns/data points they wish to include in their Report. Select individual data points or choose every data point by clicking Select All at the bottom of the screen. When finished, click Generate & Save Report.

The Report screen will then show the report along with three possible actions: View Report, Edit Report, or Delete Report.

Edit Report - allows users to edit the report by coming back to the Filtering and Columns screen.
Delete Report - Removes and deletes the report.
View Report - Displays the selected report. (A partial screenshot appears of which is displayed below)
Users can access the Filtering & Columns screen when viewing the report by clicking Filtering & Columns. Export the report as a CSV file by clicking Export Report.
