HOLISTINOTE: The Roth Explainer shows the impact of one single Roth conversion. and is linked to a specific scenario within Scenario Analysis. To see the impact of a multi-year Roth conversion strategy, check out our Roth Projection Tool.
Since the Roth Explainer is tied to a specific scenario within Scenario Analysis, its analysis uses data from that scenario. Since Scenario Analysis has several more inputs, the tax calculation within the Roth Explainer is more precise than in the Roth Projection Tool.
Contents (jump to):
Welcome to the Roth Explainer
Enabling and Accessing the Roth Explainer
- Don't see the Roth Explainer?
The Control Panel
Assets
Client Assumptions
- Life Expectancy
- Income Sources (including any Custom Income)
Expenses
- Spending (including any Custom Expenses)
- Excess Cashflow Options
- Medicare Assumptions
General Assumptions
- Tax Liability Assumption / Adjustment for Tax-Deferred Assets
- Rate of Return
- Percent of Returns Attributable to Growth
- Inflation Assumptions
Other Control Panel Features
- Graph Toggles/Options
- Warnings
- Clients
- Advisor Notes
Interpreting the Roth Explainer Results
- Projected Taxes
- IRMAA Surcharges
- Portfolio Value
- Portfolio Value Difference
- Portfolio Value by Asset Type
- Required Minimum Distributions (RMDs)
Export Results
Origin / Methodology of the Roth Explainer
Need Help? Contact Us
Welcome to the Roth Explainer
You can also view our tutorial video below, in which our VP for Subscriber Success and Engagement, Ben Birken, walks through using the Roth Explainer and interpreting the results.
HOLISTITIP: The video below features the "What is a Roth Conversion? and "Benefits of a Roth Conversion" sections, which have since been removed from the Roth Explainer report. Additional design changes and improvements have been made since that change as well. A new video will be added shortly!
Enabling and Accessing the Roth Explainer
The Roth Explainer is available to those subscribed to a Premium Plan or higher. Users with Firm Admin privileges will first need to enable the tool by navigating to Settings > Security Settings and toggling on the "Allow One Page Roth" permission setting seen below, underneath the Firm Preferences section.
To access the Roth Explainer, start in the Scenario Analysis screen, and navigate to the Roth Conversion Worksheet by clicking on the pencil icon next to the Roth Conversion line within the 1040 Income section, as highlighted below.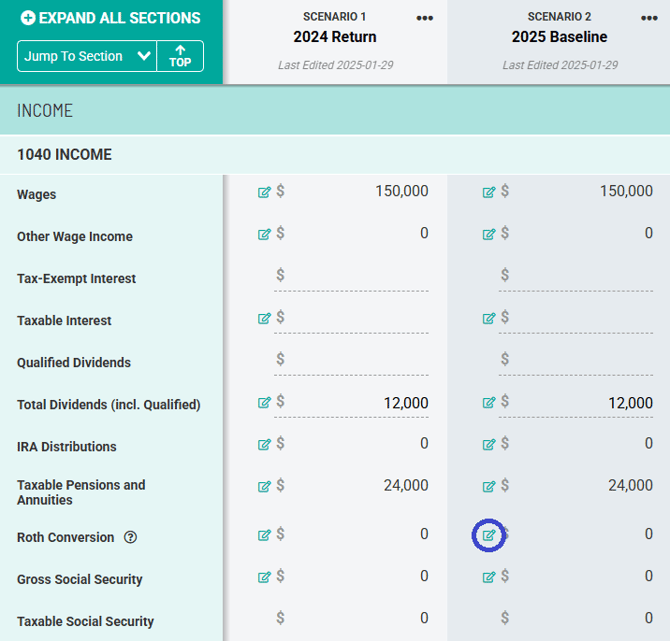
HOLISTINOTE: If you want to change the amount of the Roth conversion after accessing the Explainer, you will need to navigate back to Scenario Analysis - it cannot be changed within the Explainer tool.
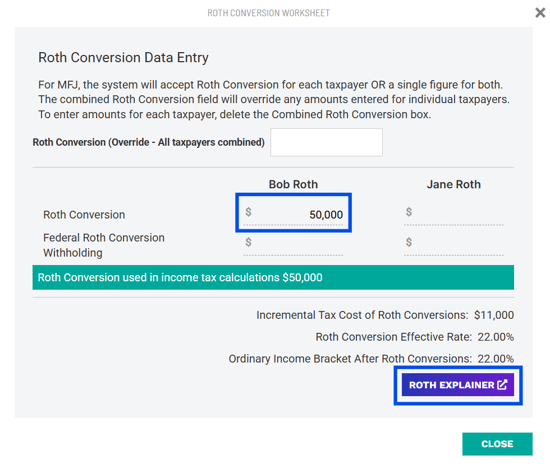
Once an entry is made for either Taxpayer 1 or Taxpayer 2, Holistiplan will summarize the incremental cost of the conversion, the effective rate, and the marginal rate on ordinary income after the conversion. The incremental tax cost refers to the incremental Federal income tax cost from that conversion, not including any state income tax impacts or changes to Medicare Premiums as a result of IRMAA (Income Related Monthly Adjustment Amount) surcharges.
Also, once a Roth Conversion amount is successfully entered, the purple Roth Explainer button will pop up to launch the Roth Explainer tool. In the example below, Bob Roth is going to make a $50,000 Roth conversion.
Don't See the Roth Explainer?
I enabled the Roth Explainer, but it's still not showing up. Why not?
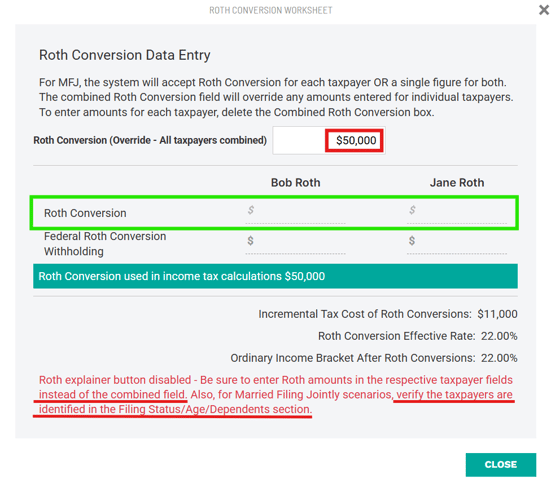
CAUTION: If you receive a message within the Roth Conversion Worksheet with the red text seen in the example below, one of the two items discussed below is causing the Roth Explainer to be disabled.
- The Roth Conversion (Override - All taxpayers combined) field is being used instead of the fields specific to Taxpayer 1 and/or Taxpayer 2. In the example below, you would clear the $25,000 entry outlined in red, which will open up the fields outlined in green to enter the amount of the Roth conversion per taxpayer.
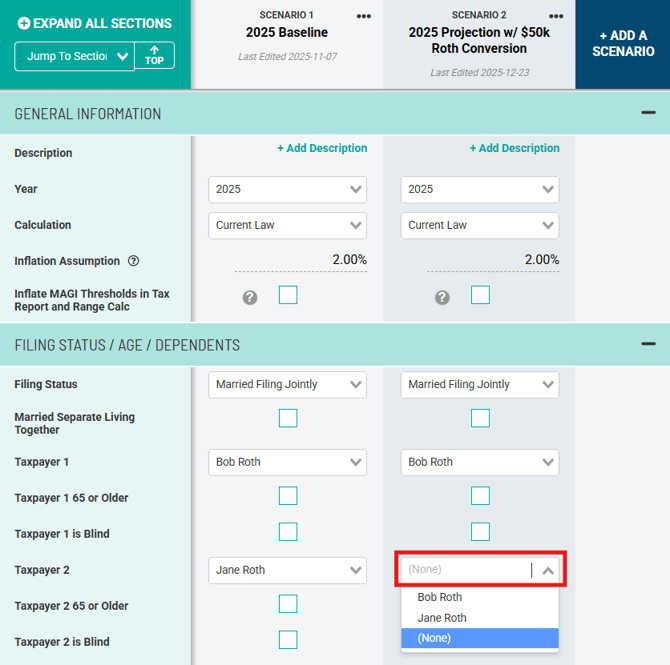
- Taxpayer 1 and/or Taxpayer 2 have not been assigned in the Age/Filing Status/Dependents tab of Scenario Analysis. In the example below, we have not assigned Cradle Will Roth as Taxpayer 2. If you have not added the second taxpayer (Cradle, for example, in this case), you will need to navigate back to the client's household and add them as a client.
The Control Panel
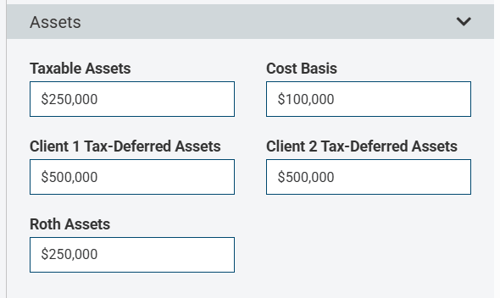
Assets:
- Taxable Assets - Enter the combined balance of all non-retirement accounts, including both cash and investments.
- Cost Basis of All Taxable Assets - Enter the cost basis of the taxable asset balance. This information is used to determine the tax impact of any taxable account distributions.
- Tax Deferred Assets - Enter the total balance of any tax-deferred assets that are subject to RMDs (Required Minimum Distributions) for Client 1 and Client 2. Do not include Inherited IRAs subject to RMDs here. Instead, enter those as an income stream (discussed later).
- Combined Household Roth Assets - Enter the combined balance for any Roth accounts for Client 1 and Client 2.
Client Assumptions:
- Life Expectancy - Enter the life expectancy of each client. We arbitrarily default to age 100.
- Income Sources (including any Custom Income)
- Wages
- Social Security
- Pensions
- Annuities
- Custom Income (NEW!)
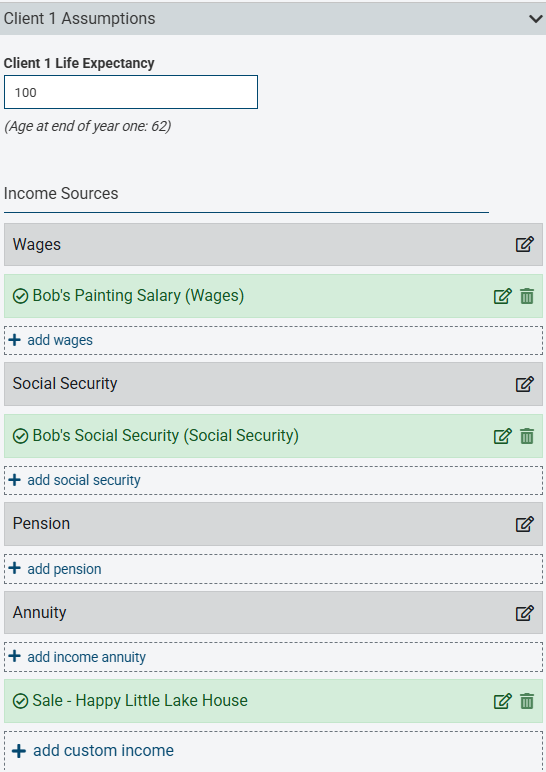
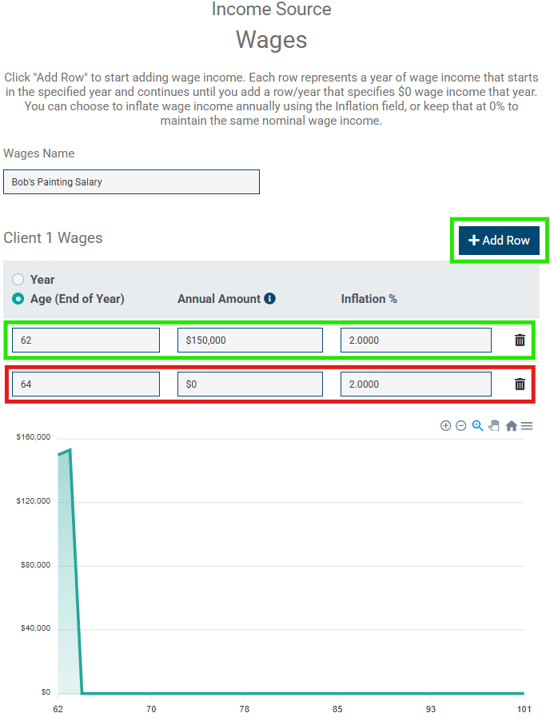
In the example below, we have added $150,000 of Wage Income for Client 1 to reflect Bob's painting salary for two years, beginning at age 62, increasing by 2.0% per year, and ending at age 64, when he retires.
CAUTION: For cash flows you want to end, you will want to enter a "$0" amount in the year following the last year of that series of income. Not entering a "$0" amount will cause that cash flow stream to continue indefinitely.
- Notice that there is a graph below the entry rows showing you the shape of that income, and by hovering over the graph, you can verify the income is occurring in the years and in the amounts you intended.
Income items are entered in today's dollars (present value), so income start/stop years or ages in the future will be inflated based on the inflation assumption entered. In the example below, we are projecting $30,000 in today's dollars to begin at this client's age 70. Since this client is currently age 62, $30,000 at age 70, inflated at 2% per year, means the $30,000 we enter will really be $35,150 at his age 70. We do not indicate a $0 row to end this cash flow, so it continues indefinitely until the end of life expectancy (age 100 here).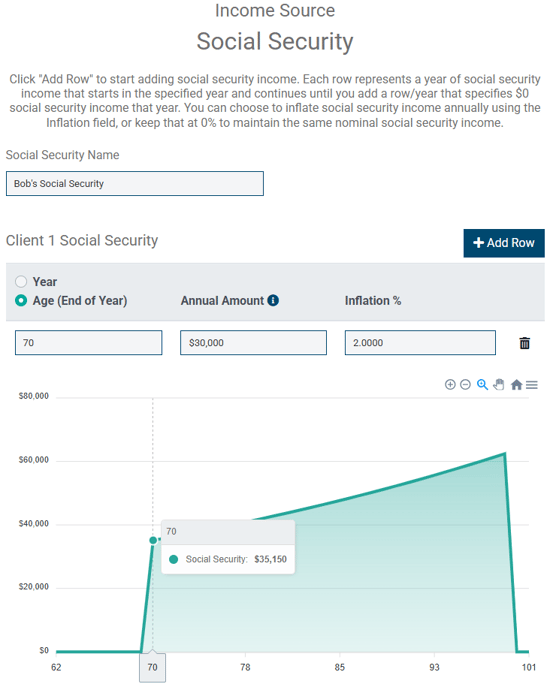
- Custom Income (NEW!):
If you want to model additional income cash flows that don't fit nicely into the categories for wages, Social Security, pensions, or annuities, you can add custom income streams as well.
To add a custom income item, first click the "Add Custom Income" box at the bottom of the income section: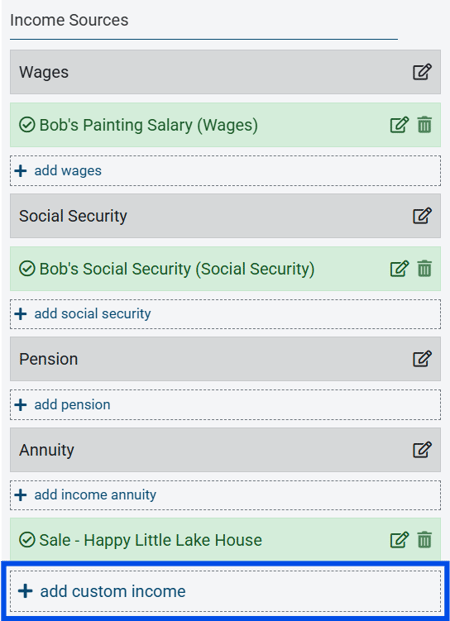
In the subsequent Custom Income box, you can:- Name your custom item (outlined in blue below)
- Indicate the percentage of income (if any) that continues to a second member of the projection at the death of the client to whom the custom income item belongs (yellow box below)
- Designate the tax nature of the custom income item (ordinary income, long-term capital gains income, or tax-free; green box below)
- Indicate how much income may be subject to taxation if there is a split between taxable and tax-free income, where outlined in purple. For example, the sale of a primary residence may bring cash flow into the client's projection. But depending on the details, some portion of that sale may be taxable and subject to long-term capital gains, while a larger portion may be received tax-free.
- As with other income items, be sure to indicate the year that the income is received or the age the client will be when he/she receives it, the amount, and any inflation assumptions applicable to this income stream. Remember to include the year when the income stops by entering that year and "0" for the amount. Otherwise, the system will think that the income will persist for the duration of the projection.
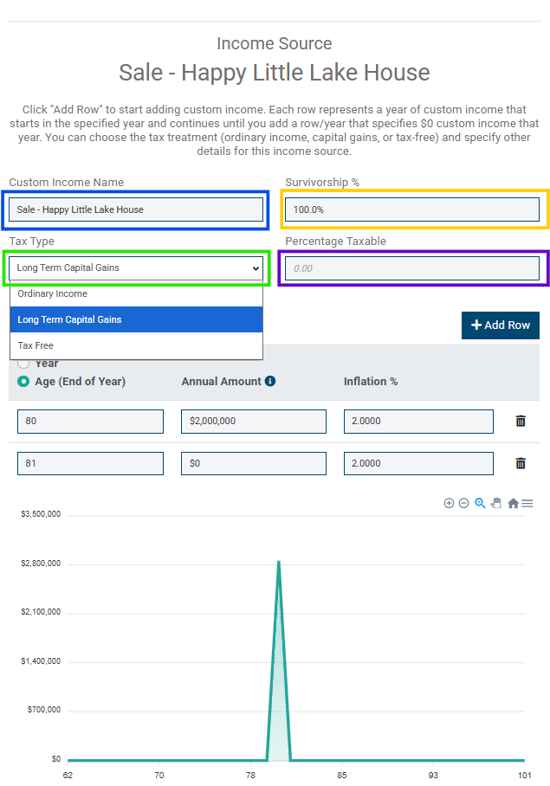
In the example above, Bob sells his lake house at age 80 for $2 million (in today's dollars - at Bob's age 62). That $2 million is inflated at 2% per year from now until Bob's age 80, so that the net capital gains income at age 80 is $2,856,492. Because this is a one-time event, note that we've entered a $0 row at Bob's age 81. This ensures that the income does not persist every year through the end of Bob's projection.
Expenses
- Spending - Enter as many spending items that make up your client's lifestyle spend number for your client. Holistiplan will tack on as additional expenses:
- Taxes: calculated within the analysis, and
- Medicare Premiums and any IRMAA: If applicable and entered in the Medicare Assumptions.
HOLISTINOTE: The Spending Assumption is entered annually and will be satisfied by income, and if necessary, portfolio distributions, in the following order:
- Income (Wages, Social Security, Pension, Annuity, or custom income)
- Portfolio Distributions:
- First: Taxable assets, then
- Second: Older spouse's tax-deferred assets, then
- Third: Younger spouse's tax-deferred assets, and finally
- Fourth: Roth (tax-free) assets, as needed.
This order is followed with one caveat. Once your client reaches Required Minimum Distribution (RMD) age, the system uses those RMDs as the first component of portfolio distributions. If that is still insufficient to meet spending needs, the system then follows the order noted above.
- Custom Expenses (NEW!):
Use "custom expenses" to model additional expenses beyond baseline spending, spending that might inflate at different rates of inflation, or one-time expense items.
To start, click the "Add Custom Expense" link in the Expenses section, where shown outlined below.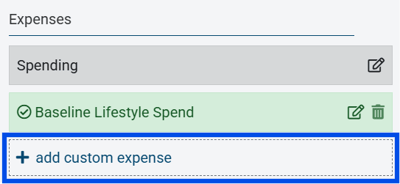
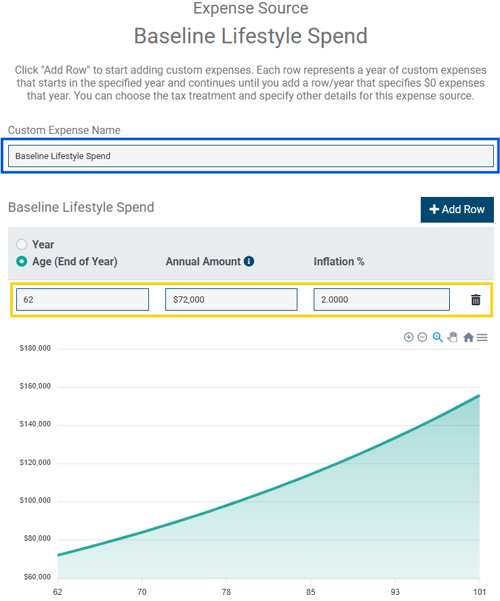
In the subsequent Custom Expense window, you can enter:- The name of your custom item (blue box below)
- The year/age the expense begins, the annual amount (in today's dollars), and a custom inflation assumption for that particular expense (yellow box below).
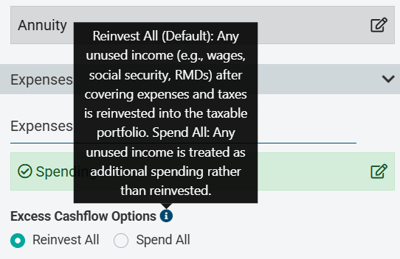
- Excess Cashflow Options - To the extent that income (Wages, Social Security, Pension, or Annuity) is enough to cover expenses (spending, taxes, Medicare premiums), any excess cashflow can either be toggled to "Reinvest All," which add that surplus each year back into taxable assets to be re-invested, or "Spend All," which considers any surplus to be additonal expenses, lost to spending for the remainder of the analysis.
- Medicare Assumptions - Check the boxes for Medicare Part B and/or Part D, if you want Holistiplan to calculate any IRMAA (Income-Related Monthly Adjustment Amounts) to Medicare premiums within the analysis. For Medicare Part B, indicate the age at which your client will begin receiving Medicare Part B benefits. For Medicare Part D, indicate the base annual Medicare Part D premium.
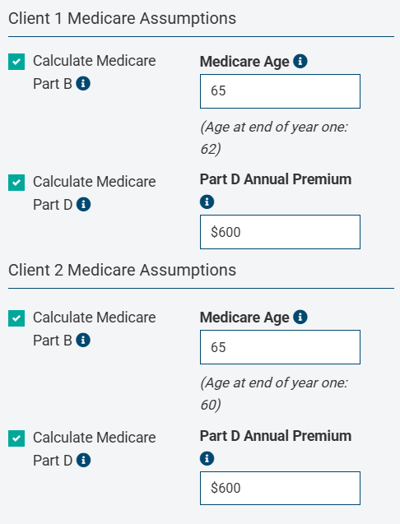
HOLISTITIP: While every participant in Medicare Part B starts with a base premium, for Medicare Part D, the premium varies based on the plan the participant selects and their location. For that reason, you must enter a base annual Part D premium.
General Assumptions
- Tax Liability Assumption / Adjustment for Tax-Deferred Accounts - This setting effectively reduces the tax-deferred balances by the amount of the percentage indicated to reflect the embedded tax liability for those accounts. We default to 24% arbitrarily.
For example, if the total balance for all tax-deferred accounts were $1,000,000, and the tax adjustment assumption was set to 24%, the adjustment to the tax-deferred account balances would reduce them by 24% ($240,000), and effectively use a new balance of $760,000 in the projections to account for the after-tax funds available from those accounts. You can check or uncheck the box for this field at any time.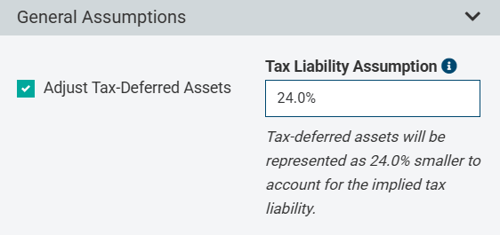
- Rate of Return - Return assumption for the portfolio as a whole. Return by account type or for specific accounts is unsupported. We default to 8% arbitrarily.
- Percent of Returns Attributable to Growth - This assumption allows you to indicate how much of the rate of return is due to growth and how much is due to income. The default value for this field is 50%, but that value is purely arbitrary.
A higher portion of returns that are assigned to growth ("capital gains") means less tax drag, making the taxable account more tax-efficient. A good proxy for this assumption is for the percentage to equal the equity allocation of the taxable assets. For example, if the taxable assets are invested 50/50 (equity/fixed income), the 50% entered in the example below is a good approximation. Keep in mind that the taxable assets balance may include not only investment positions but also cash positions.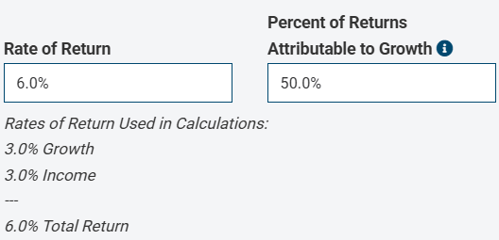
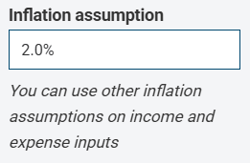
In the example above, half of the 6% return, or 3% per year, will be taxed as "income" from the portfolio, while half of the 6% return (or 3%) will remain in the taxable assets balance, to be grown for eventual distribution in the future, at long-term capital gains rates. - Inflation Assumption - Enter the assumed inflation assumption for tax brackets, standard deduction, and IRMAA brackets. Inflation assumptions for spending and income items are added for each of those items individually, and not in this field.
Other Control Panel Features
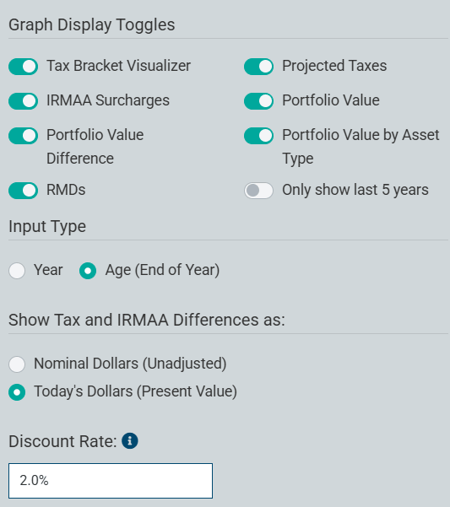
- Graph Toggles/Options - Toggles exist to show or hide the Tax Bracket Visualizer, Projected Taxes, IRMAA Surcharges, Portfolio Value, Portfolio Value Difference, Portfolio Value by Asset Type, and RMDs section, as well as only to show the last 5 years of portfolio balance estimates. You can also choose to input data by the calendar year or client age, and to show tax and IRMAA differences in nominal dollars (unadjusted) or today's dollars (net present value using a discount rate), depending on what makes the most sense for you.
For more resources on the appropriate discount rate to use when evaluating Roth conversions, click on the informational message icon circled below to read more. Advisors are likely familiar with using the inflation assumption as a discount rate in time-value-of- money (TVM) calculations, but potentially more appropriate discount rates are discussed in the articles referenced in the informational message. Holistiplan is agnostic on whether you discount these items and which discount rate is appropriate (if any) for your analysis.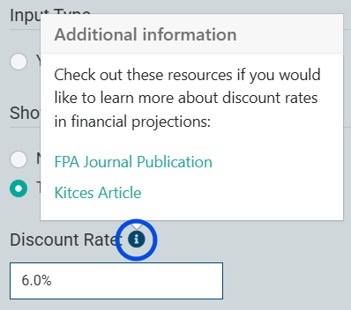
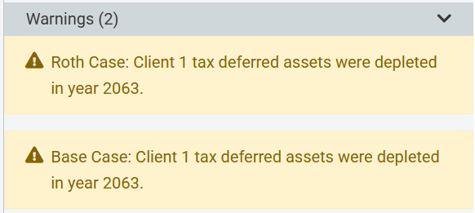
- Warnings - These cautionary warnings indicate when some entries were not modeled fully as intended, due to calculations made within the analysis. Any warnings preventing the Roth Projection analysis from being completed will appear in red at the top of the Roth Projection page.
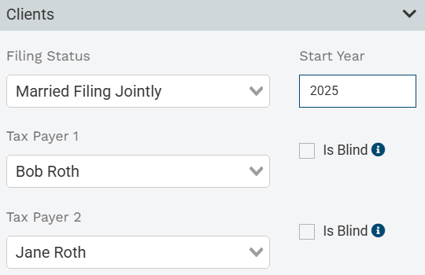
- Clients - Adjust the information for your clients that you entered when creating the Roth Projection, including filing status, assigning Taxpayer/Client 1 and Taxpayer/Client 2, the year the analysis will begin, and indicate if either taxpayer is eligible for the additional standard deduction for blindness.
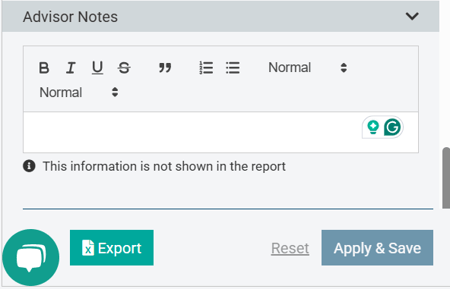
- Advisor Notes - Use this section as a spot to jot any notes for yourself about your analysis. The "Advisor Notes" section is not shown in the report, so these notes will not print when creating a PDF deliverable for your client or when viewing the Roth Projection analysis in Presentation Mode.
Interpreting the Roth Explainer Results
Once you have built out the foundational assumptions within the Roth Explainer, your Roth Explainer Results will look like the example below. The Control Panel will be on the left side of your screen, where you can make edits to assumptions and other changes. The right side of your screen will show a preview of the Roth Projection output, complete with your firm logo and any disclaimer language.
You will also see buttons at the top right of the preview panel to view the Roth Projection in Presentation Mode (without the Control Panel) and to print the Roth Projection.
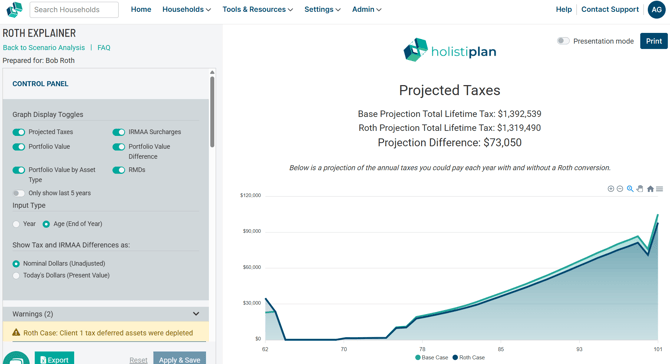
Projected Taxes:
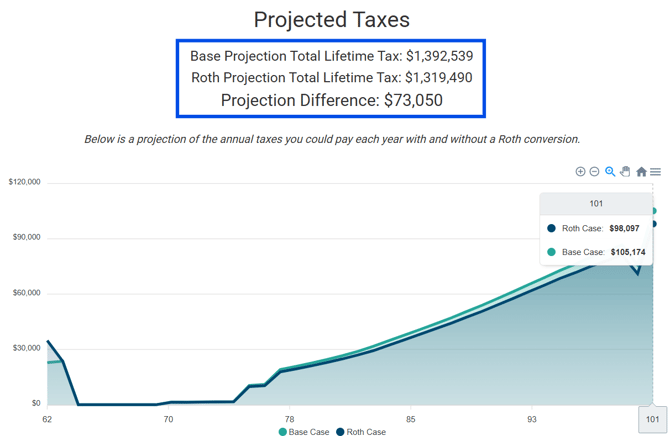
The Projected Taxes graph shows lifetime tax projections of both the base scenario (with none of the Roth conversions entered earlier) and the Roth conversion scenario, which are outlined in blue above. The projection difference indicates the lifetime tax savings anticipated by executing the Roth conversions as entered earlier when you built your projection. In the example above, we see that by utilizing Roth conversions over several years, this client is projected to save $73,050 in taxes.
If you'd like, you can show a net present value of the nominal amount of tax savings shown above by clicking the toggle in the Control Panel shown below. In this case, we've discounted those tax savings by 6%, an amount equal to our portfolio return. If you are unsure about which discount rate to use, check out the (?) icon circled below for two resources that delve into the appropriate discount rate to use.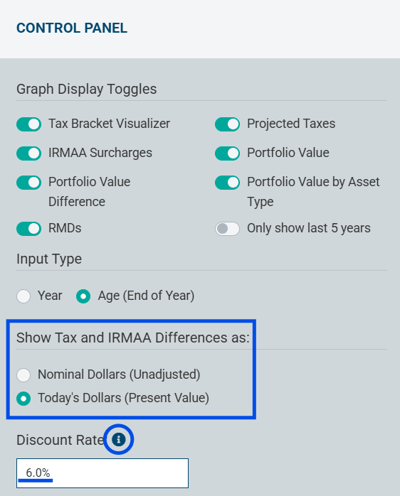
Even when discounting the tax savings, there is a respectable amount of tax savings as a result of undertaking this Roth conversion strategy, as seen below.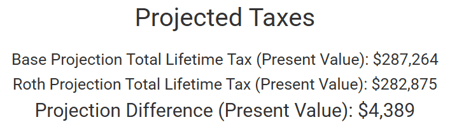
IRMAA Surcharges:
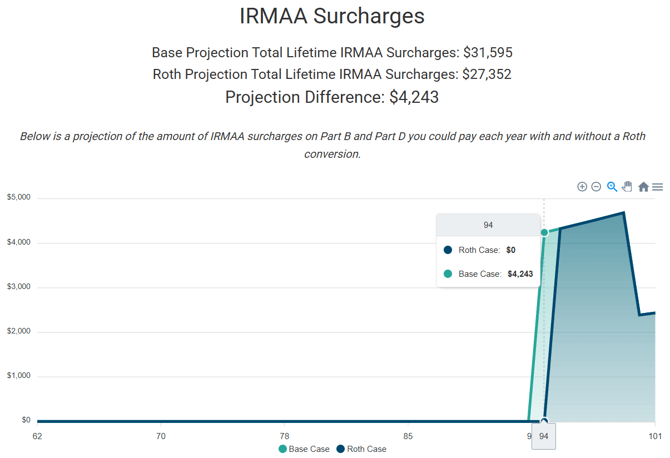
While not technically a tax, IRMAA (Income-Related Monthly Adjustment Amount) surcharges on Medicare Part B and D Premiums can be a consideration for Roth conversion planning as well. Within the Roth Explainer, you can see the impact of this single Roth conversion on IRMAA surcharges. To enable this additional graph, toggle on this option in the Control Panel.
Above, you will see that as a result of the Roth conversions, there is a savings of $4,243 in IRMAA surcharges down the road as a result of reducing the income that is pushed out from future RMDs (Required Minimum Distributions) from those tax-deferred retirement accounts as a result of the Roth conversion. Similar to the Projected Taxes graph, you can also discount the IRMAA Surcharge into a net present value as well by using that same toggle. 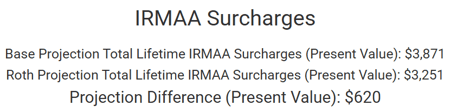
Portfolio Value:
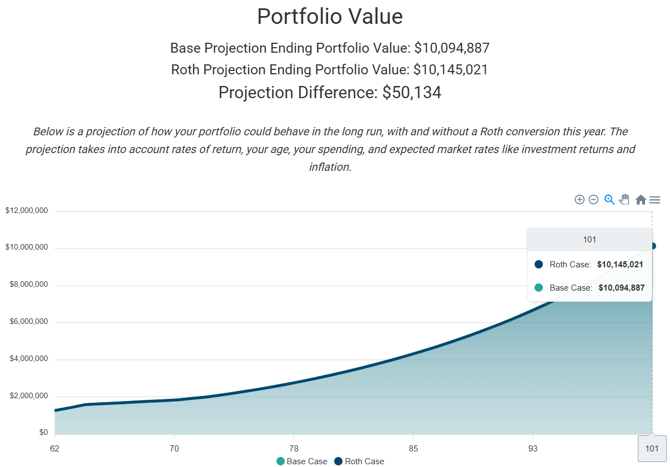
The graph will show the cumulative effect of a single year of Roth conversion on the combined portfolio balance by the end of the plan, which corresponds to the user-entered life expectancy for the longest-lived member in the household.
In the example above, the projected total portfolio balance is $10,145,021 if the Roth conversion were to be done, compared to $10,094,887 if not done, indicating total portfolio assets would be estimated to be $50,134 higher.
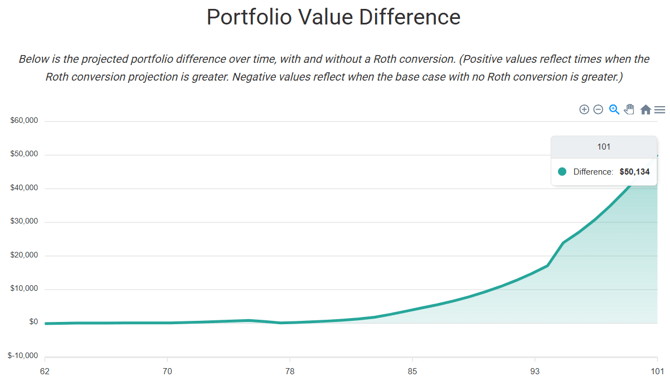
The base case and Roth conversion lines on the graph are sometimes so close that it may be difficult to see the difference, which is why we include a "Portfolio Value Difference" as part of the Roth Explainer analysis. This graph represents the total portfolio value of the Roth Case minus the Base Case. The point at which the curve becomes positive is sometimes referred to as the 'break-even' or 'crossover point,' when the hurdle that is the cost of the conversion is eclipsed by the increase in the tax-free growth of the amount converted.
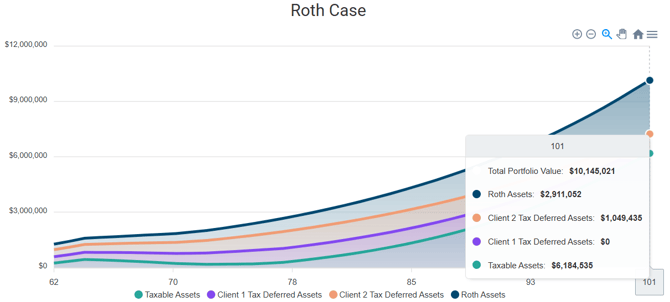
Portfolio Value by Asset Type:
You can also view the various account balances across the taxable assets, tax-deferred assets for each client, and the combined Roth assets. The balances on these pots of money are shown under the Base Case scenario and the Roth Scenario. Hovering over the graph area will show the balances over time of each asset type as you move along the x-axis.
These two graphs are particularly powerful in illustrating the mix of assets a client will pass on to their beneficiaries if there is a legacy goal in connection with a Roth conversion strategy.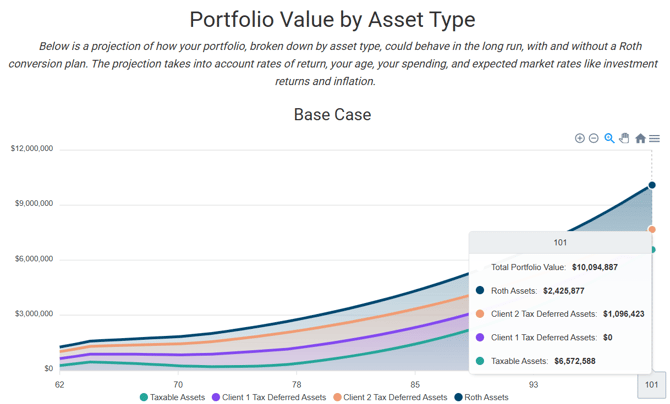
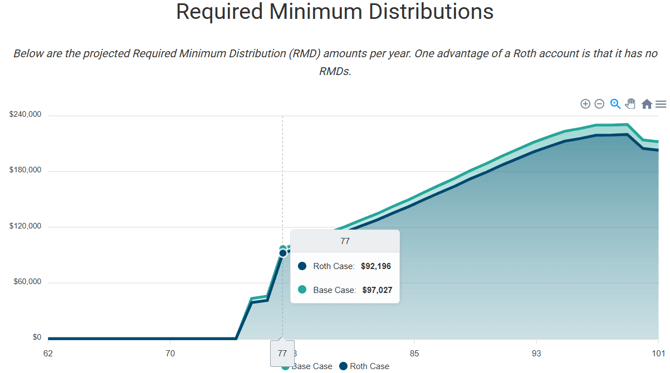
Required Minimum Distributions (RMDs):
If toggled on in the Control Panel, the next graph on the report will be an illustration of the projected RMD amounts coming from tax-deferred accounts for both the Base Case and Roth Conversion scenarios. This can be particularly helpful in illustrating the impact of the Roth conversion on potentially reducing RMDs in later years, especially for clients who will not need their full RMD to meet spending needs.
In the example below, this one-time $50,000 Roth conversion will lower the RMDs these clients would otherwise have to take. When both clients begin RMDs at Client 1's age 77 (remember, taxpayers born in 1960 and later have an RMD of age 75, and Client 2 is two years younger than Client 1), the total RMDs between both clients are $4,831 lower per year as a result of converting that $50,000 in year one.
The end of the Roth Projection will include a summary of the assumptions used in the analysis and any disclaimer language added by your firm.

Export Results:
At the bottom of the Control Panel, you can click the "Export" button shown below to view a spreadsheet of the math behind the projections. 
That spreadsheet contains two tabs - one labeled "Projection" (representing the Base Case) and a second labeled "Roth Projection" (reflecting the Roth conversion scenario). The spreadsheet includes the variables and data that feed various graphs on the Report, including income sources and amounts, RMD amounts, changing portfolio balances over time, tax costs, etc. The column titles in the spreadsheet include comments that further define what you are seeing in that column and, depending on the column in question, how we calculate the amounts displayed.
For more details, we have included the video below of a walk-through of the math under the hood in the spreadsheet.
Origin/Methodology of the Roth Explainer
If you would like to learn about the origin of the Roth Explainer, check out the video below in which our co-founder, Roger Pine, breaks it all down in a behind-the-scenes look.
If you have any questions about the Roth Explainer, please Contact our Support Team for further assistance!